Moku:Go’s Spectrum Analyzer
Compare all spectrum analyzers
Overview
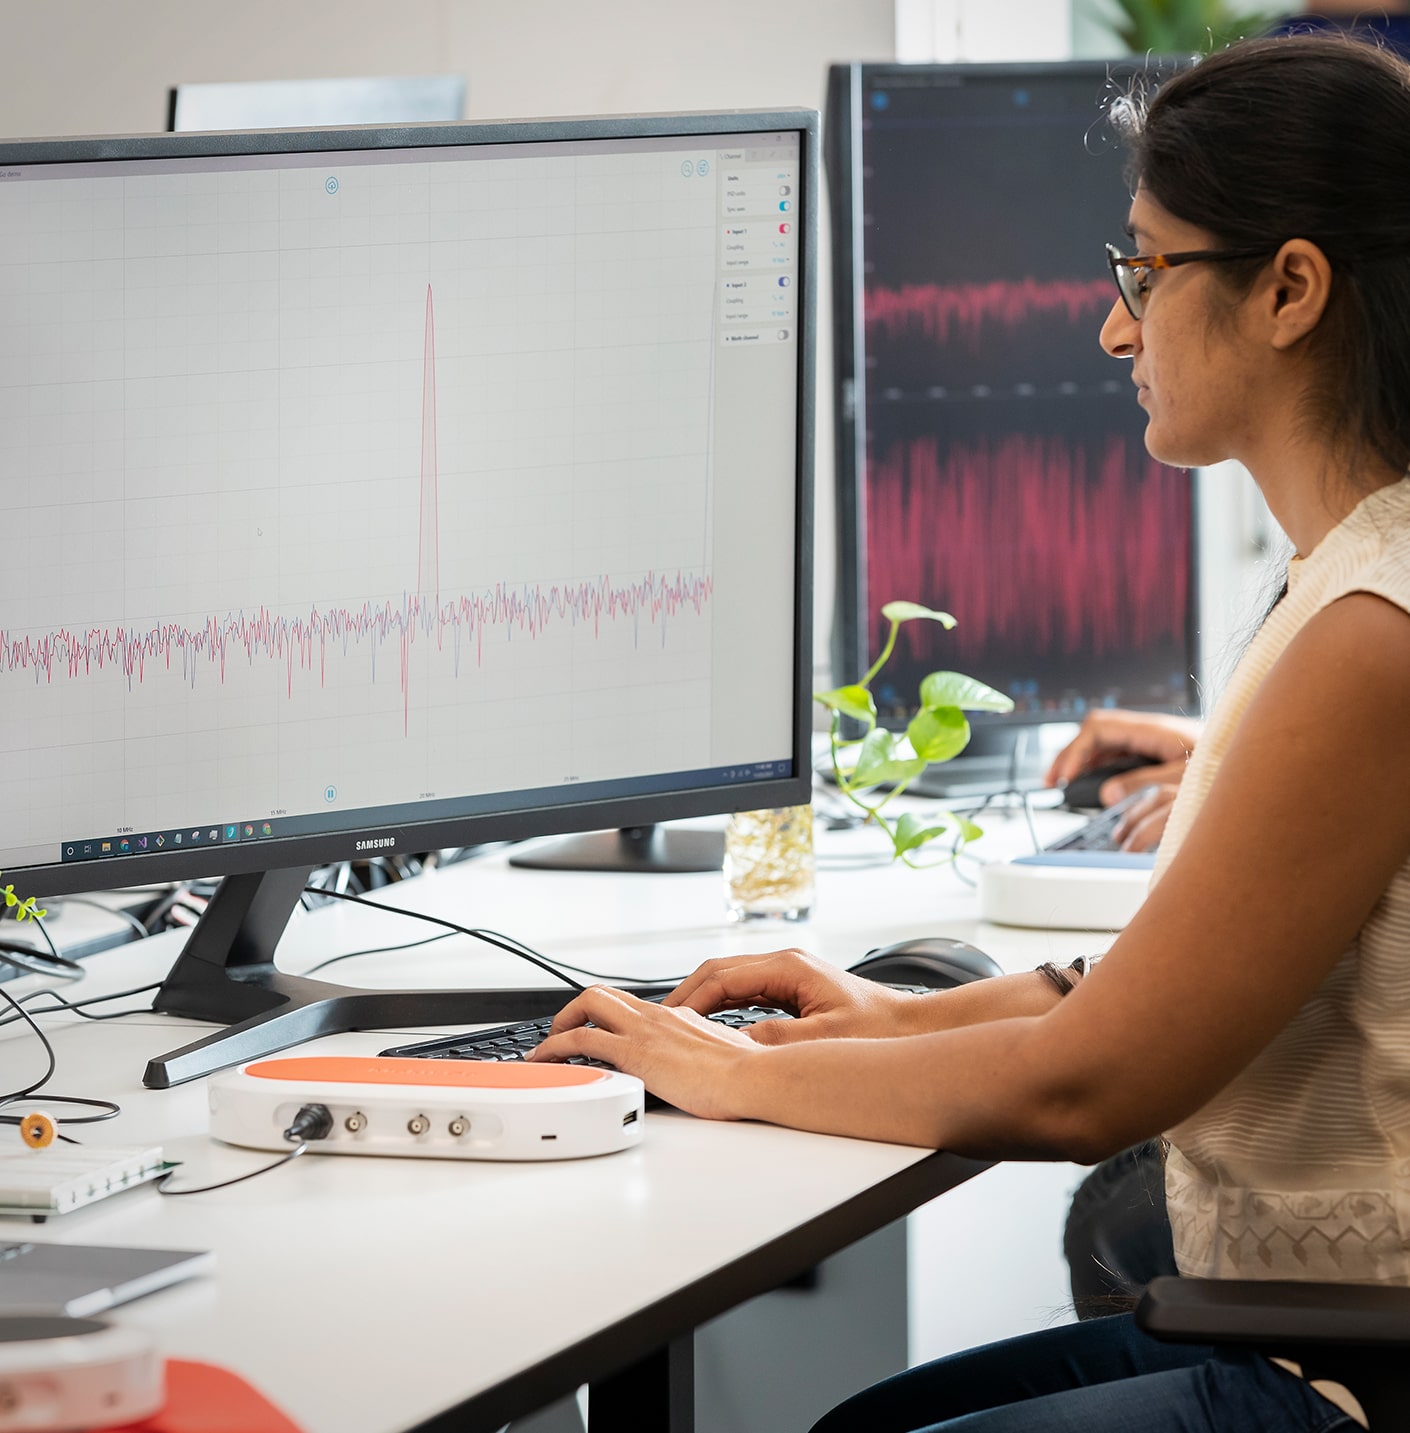
Moku:Go’s Spectrum Analyzer allows you to observe input signals in the frequency domain between DC and 30 MHz. The frequency down-conversion / FFT hybrid approach provides significant improvement in dynamic range and spectral resolution compared to an FFT-based spectral analysis. View two channels of data simultaneously with a resolution bandwidth as low as 1 Hz over a minimum span of 100 Hz. The Spectrum Analyzer also features two integrated waveform generators capable of producing sine waves at up to 20 MHz.

Specs
Frequency range
DC to 30 MHz
Frequency span
100 Hz to 30 MHz
Resolution bandwidth (RBW)
Span dependent, minimum RBW is 1 Hz
Video filter bandwidth
10 Hz to 2.4 MHz
Number of inputs
2
Input range
10 Vpp
Input impedance
1 MΩ
Number of outputs
2
Output voltage
5 Vpp into 50 Ω
Key features
High bandwidth input and output options
Display and record power spectra or power spectral densities in the frequency domain from DC to 30 MHz.
Onboard signal generators
Generate two sine waves up to 20 MHz using Moku:Go’s analog outputs
Measurement cursors
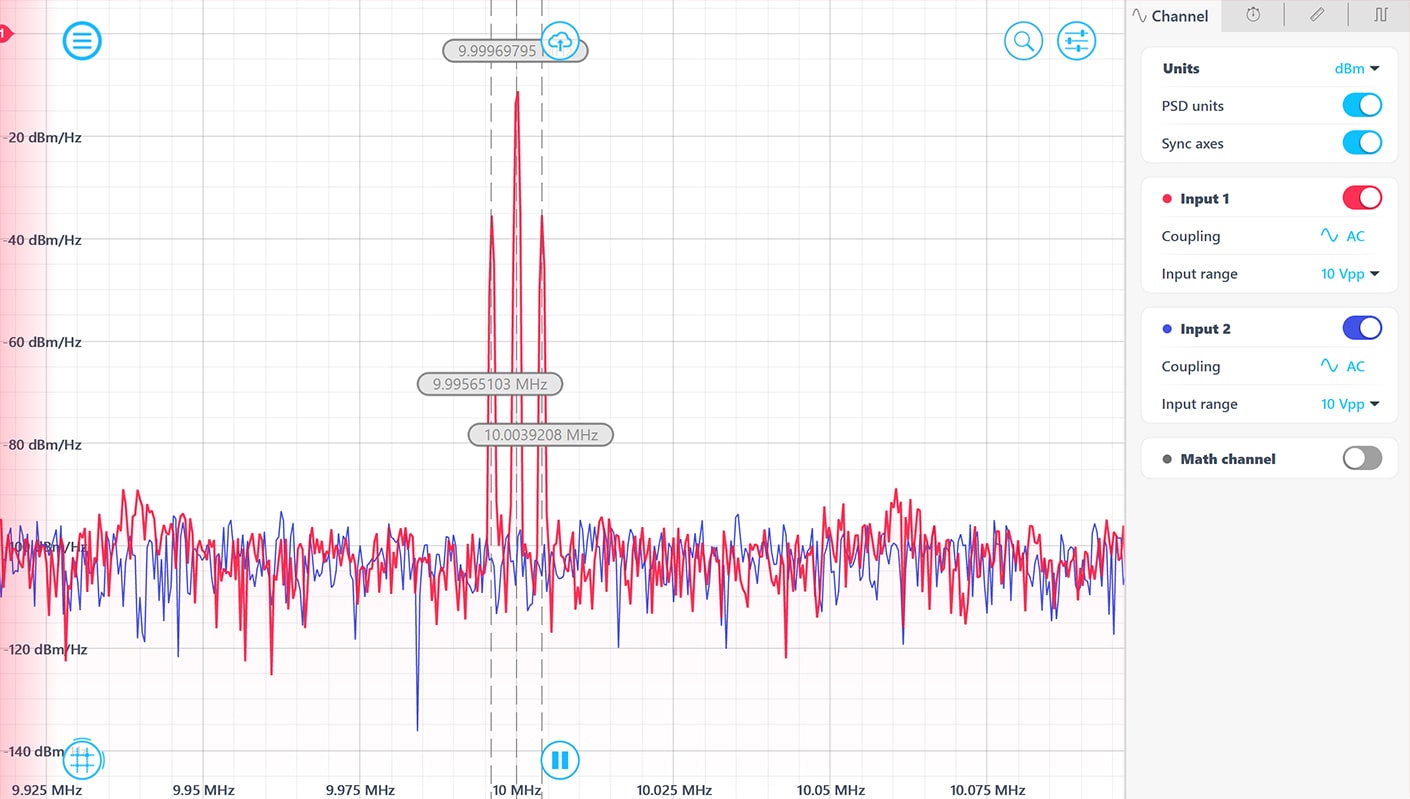
Quickly measure spectral power by dragging measurement cursors onto features of interest using the intuitive interface
Applications
Frequency domain analysis
System response characterization
Noise measurement
Spurious signal identification

Intuitive software for Windows and Mac
Observe signals in the frequency domain, analyze data, and share results with Moku software. Free and easy to use, all 8 instruments are included with no software license required.
Try it in demo mode
Example lab: A.M. sidebands
One of the benefits of a dedicated FFT-based spectrum analyzer is that it is possible to observe the crucial sidebands of an A.M. modulated signal.
Read the full app note

Measurement markers
Probe up to four peaks using the Spectrum Analyzer’s measurement markers. Real-time and historical trends of peak level, frequency, power, and more are all available at a glance.

Available on Moku:Go hardware
A powerful FPGA paired with a high-quality analog front-end make Moku:Go the most robust hardware in education, capable of complex, real-time digital signal processing. Integrated WiFi hotspot and programmable power supplies ensure that students have the complete solution they need all four years (and beyond).
Like Moku:Go’s Spectrum Analyzer?
View pricing Learn about Moku:Go hardware
Or compare all hardware platforms


