Spectrum Analyzer
Frequency range (up to)
250 MHz
Frequency span
1 kHz to 250 MHz
Minimum RBW
1 Hz
Waveform generator
Integrated

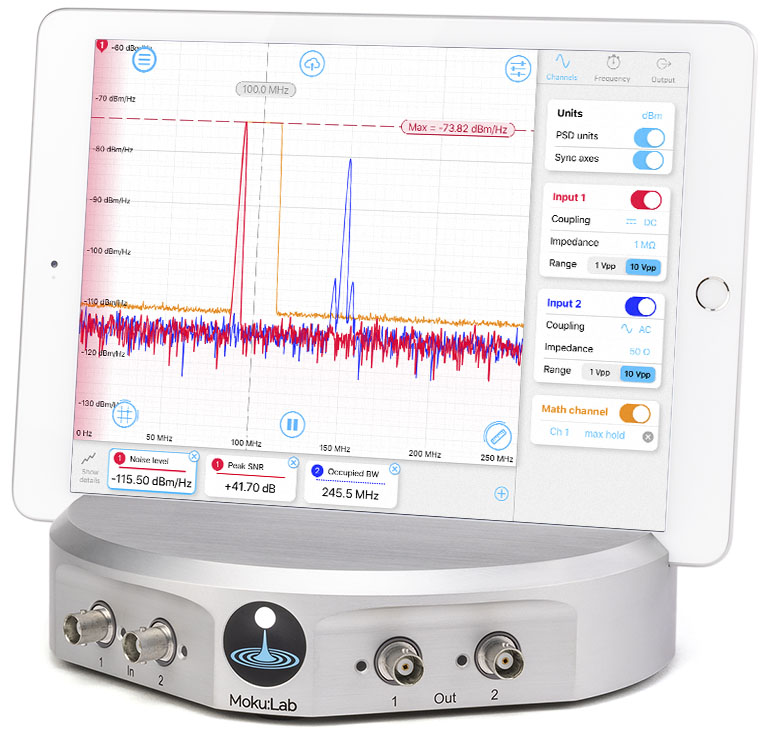
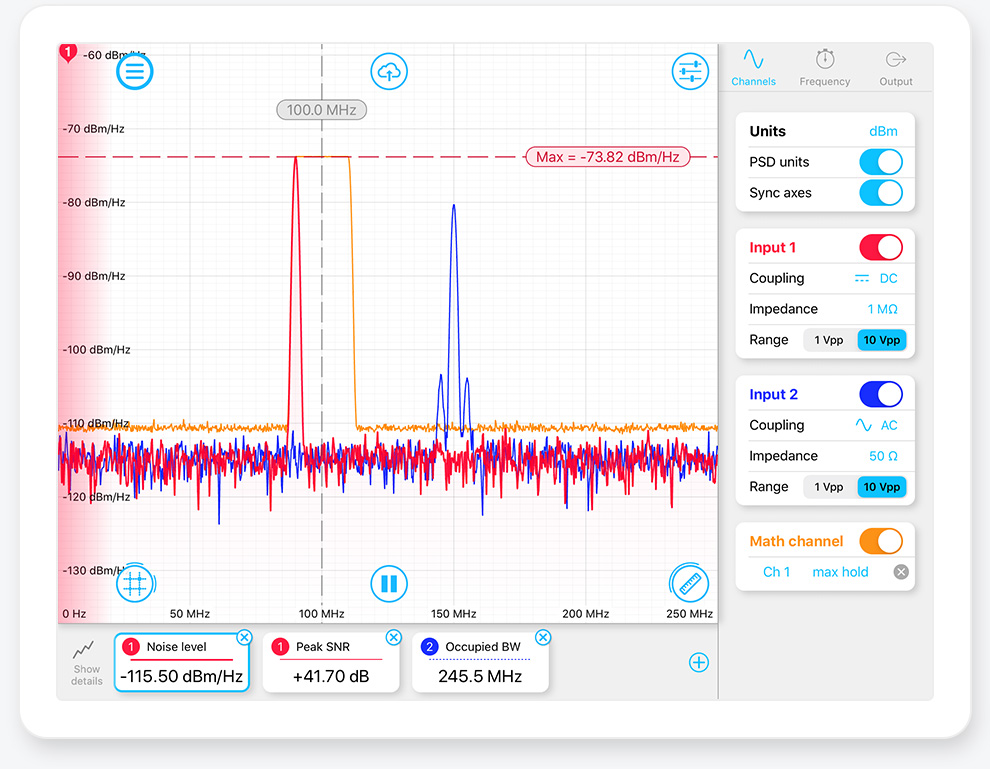
Moku:Lab’s Spectrum Analyzer allows you to observe input signals in the frequency domain between DC and 250 MHz. View two channels of data simultaneously with a resolution bandwidth as low as 1 Hz over a minimum span of 100 Hz. The Spectrum Analyzer also features two integrated waveform generators capable of producing sine waves at up to 250 MHz.
Features
High bandwidth input and output options
Display and record power spectra or power spectral densities in the frequency domain from DC to 250 MHz
Generate two sine waves up to 250 MHz using Moku:Lab’s built-in analog outputs
Additional display settings
Video bandwidth filtering, Averaging, Persistence
Intuitive graphical user interface with versatile API support
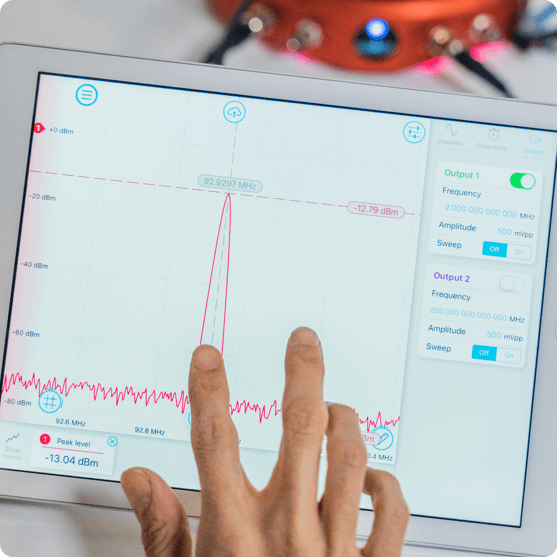
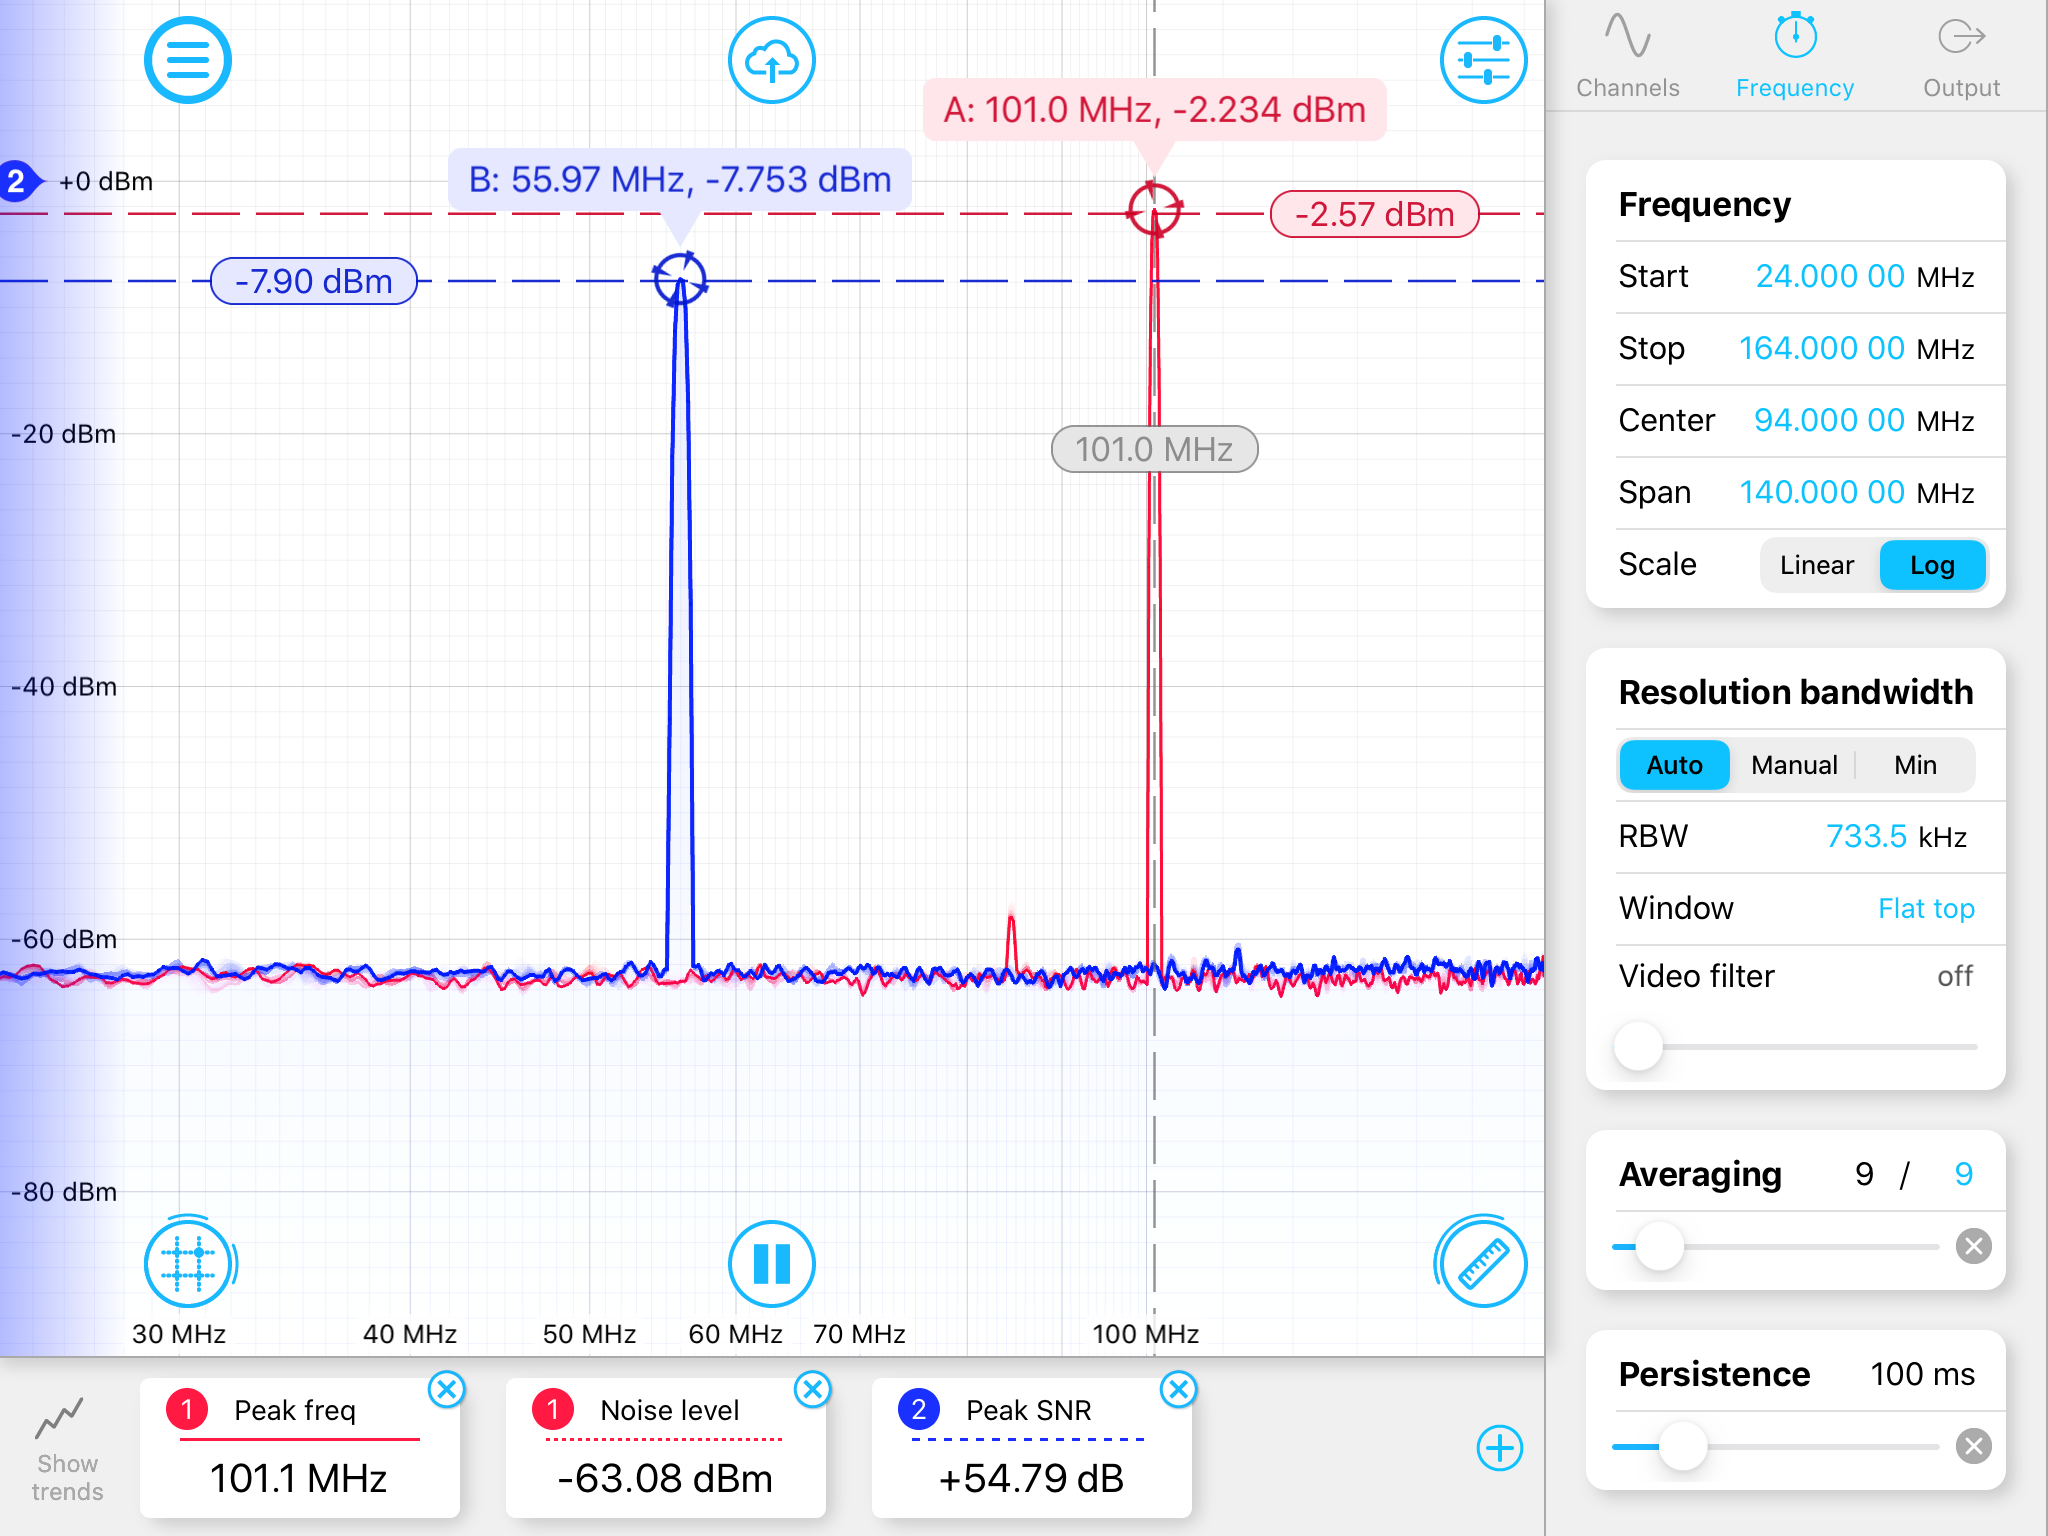
Quickly measure key metrics by dragging measurement cursors onto features of interest using the iPad’s multi-touch interface
Python, MATLAB and LabVIEW APIs for advanced programming support
App Note
Intro to Spectrum Analyzer


Multitouch user interface
The multitouch user interface really shines with Moku:SpectrumAnalyzer. No need to wrestle with frequency range settings and start/ stop/ span inconsistencies. The Spectrum Analyzer features a frequency range of 200 MHz (extended to 250 MHz in software) and resolution bandwidths down to 1 Hz, all with super fast update rates thanks to the DSP power of Moku:Lab’s FPGA.

Moku:Lab’s Spectrum Analyzer inherits the best features from Moku:Lab’s Oscilloscope
This includes tracking cursors, averaging, persistence and, of course, simple sharing of data via DropBox, iCloud and email. The math channel in Moku:Lab’s Spectrum Analyzer includes options to display Max Hold or Min Hold data of a channel. You can display your data with a log or linear power spectrum or power spectral density or even visualize the evolution of spectra with 3D waterfall plots.


